Azure Tutorial
Azure Storage Service
Network Services
Compute Services
App Services
Database Service
Azure Misc
- What is MS Azure Functions
- What is ETL
- What is Microsoft Azure Instance
- What is Databrick
- Why is PowerShell Used
- What is a Notebook in Ms Azure
- What is Azure Resource Manager
- What is a container group In Microsoft Azure
- What is Microsoft Azure Functions Premium plan
- What is Microsoft Azure Subscription
- What is Azure Lighthouse
- Active Directory Identity in Azure and access management operations
- What is Privileged Access Management for Active Directory Domain Services in Azure
- What is the difference between Azure DevOps Server and Azure DevOps Services
- Azure Fundamentals
Azure Interview Questions
Azure App Service Monitoring
Microsoft provides different features to monitor our App service.
Quotas
Application hosted in App Service is subject to certain limits on the resources they can use. The boundaries are defined by the App Service plan associated with the app. When we create an app service plan, we generally select a pricing tier and also size. Based on the size and pricing tier, we'll be allocated with a certain amount of CPU and a certain amount of memory. Quotas for Free or Shared apps are as follows.
- CPU(Short)
- CPU(Day)
- Memory
- Bandwidth
- Filesystem- Applicable for Basic, Standard, and Premium plans
The only quota applicable to apps hosted on Basic, Standard, and Premium plans is Filesystem, based on the number of App service plans that we have created in our subscription.
Metrics
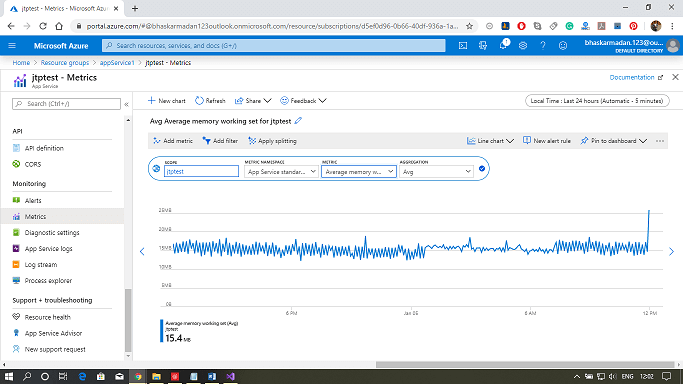
Metrics provide information about the app or App Service plan's behaviour. So Metrics are provided at two levels.

- One is at the App service plan level, which will include CPU and Memory percentage, Data in and out, Disc queue length, and HTTP queue length.
- The second level of metrics provided at an application level, which includes average response time, average memory working set, CPU time, Data in and out, etc. All of these metrics are essential. There are a lot more metrics available when we go for application insight, which is an advanced monitoring tool using which we can monitor web apps.
Granularity and retention
- Minute granularity: These metrics are retained for 30 hours.
- Hour granularity: These metrics are retained for 30 days.
- Day granularity: These metrics are retained for 30 days.
However, if we use the application insights, then this retention will increase drastically.
Diagnostics
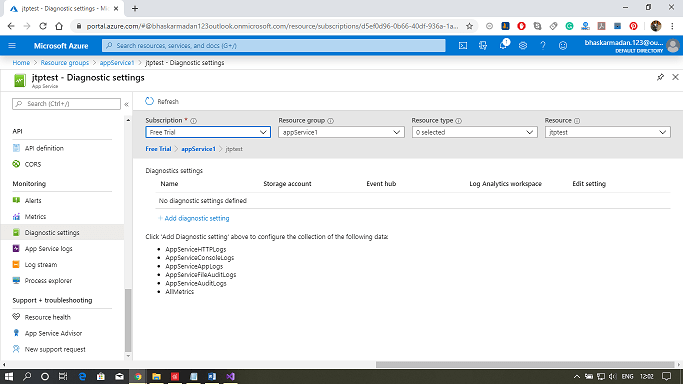
App service web apps provide diagnostic functionality for logging information from both the web server and the web application. These are logically separated into web server diagnostics and application diagnostics.

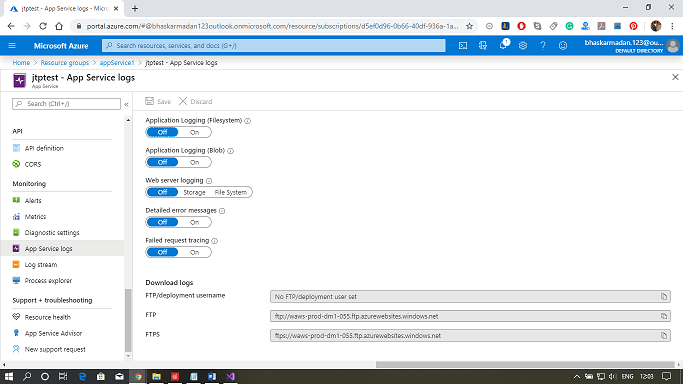
Web server Diagnostics: In this, we can have a detailed error logging, which is any Http 400, and the above error will get logged. We can also view the logs. And the second thing is failed request tracking, which basically contains the trace of IIS components that are used to process our request. And the third one is web server logging. These are the overall metrics on how many Http requests we received, and from a particular IP address.
Application Diagnostics: It allows us to capture the information produced by the web application. So if we're using system diagnostic trace, all the information will be provided by application diagnostics.
Diagnostic information can be stored in file system or Azure storage.
Stream logs
During the development of an application, it is often useful to see logging information in near-real-time. We can steam logging information to our development environment using either Azure PowerShell or the azure Command-line interface.

These are the basic commands that we need to use to stream the log files.
- Streaming with Azure PowerShell
- Get-AzureWebSiteLog - Name webappname -Tail
- Get-AzureWebSitelog - Name webappname -Tail -Message Error
- Streaming with Azure Command-Line Interface
- az webapp log tail - name webappname -resource-group myResourceGroup
- az webapp log tail -name webappname -resource-group myResourceGroup -filter Error


