Selenium Tutorial
Selenium IDE
Selenium WebDriver
selenium Misc
Selenium Python
Selenium C#
Selenium Maven
Selenium Interview Questions
IDE-Features
Selenium IDE-Features
Selenium IDE is divided into different components, each having their own features and functionalities.We have categorized seven different components of Selenium IDE, which includes:
- Menu Bar
- Tool Bar
- Address Bar
- Test Case Pane
- Test Script Editor Box
- Start/Stop Recording Button
- Log, Reference Pane
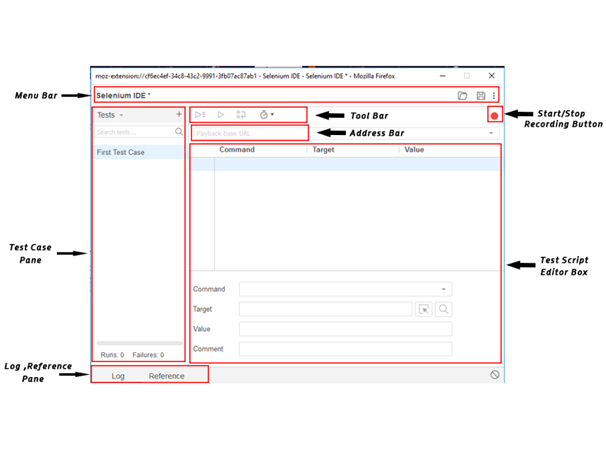
Now, we will look at the features and functionalities of each component in detail.
1. Menu Bar
Menu bar is positioned at the top most portion of the Selenium IDE interface. The most commonly used modules of menu bar include:
- Project Name
It allows you to rename your entire project.

- Open Project
It allows you to load any existing project from your personal drives.

- Save Project
It allows you to save the entire project you are currently working on.

2. Tool Bar
The Tool bar contains modules for controlling the execution of your test cases. In addition, it gives you a step feature for debugging you test cases. The most commonly used modules of Tool Bar menu include:
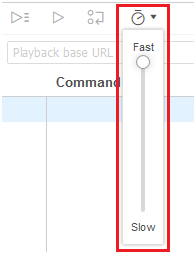
- Speed Control Option
It allows you to control the execution speed of your test cases.
- Step Feature
It allows you to "step" through a test case by running it one command at a time. Use for debugging test cases.

- Run Tests
It allows you to run the currently selected test. When only a single test is loaded "Run Test" button and "Run all" button have the same effect.

- Run All
It allows you to run the entire test suite when a test suite with multiple test cases is loaded.

3. Address Bar
This module provides you a dropdown menu that remembers all previous values for base URL. In simple words, the base URL address bar remembers the previously visited websites so that the navigation becomes easy later on.

4. Test Case Pane
This module contains all the test cases that are recorded by IDE. In simple words, it provides the list of all recorded test cases at the same time under the test case pane so that user could easily shuffle between the test cases.
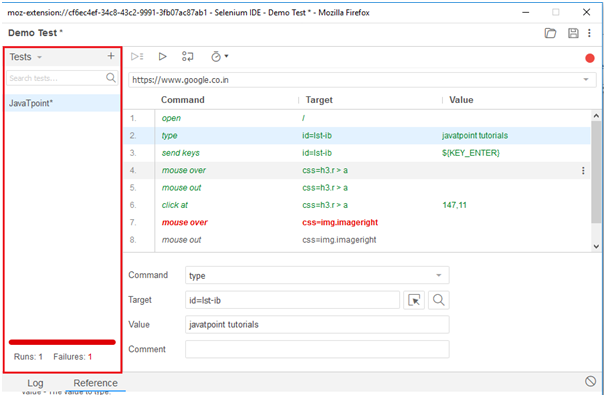
At the bottom portion of the Test Case Pane, you can see the test execution result summary which includes the pass/fail status of various test cases.
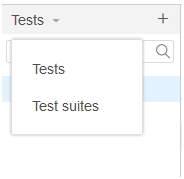
Test Case Pane also includes features like Navigation panel which allow users to navigate between test cases and test suites.
5. Test Script Editor Box
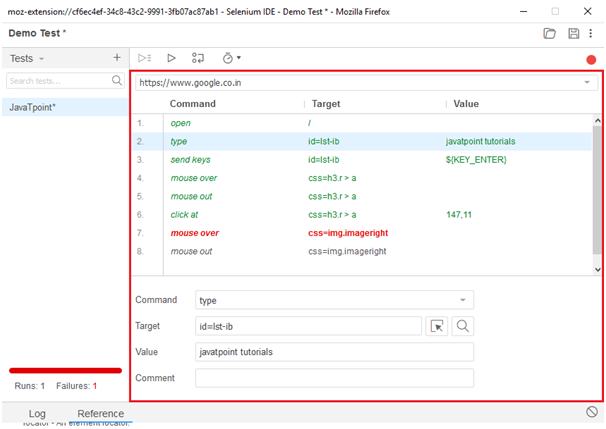
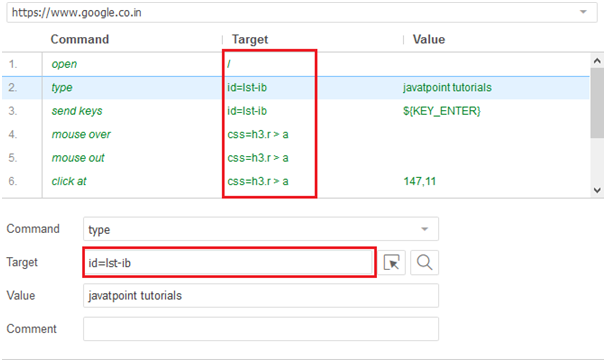
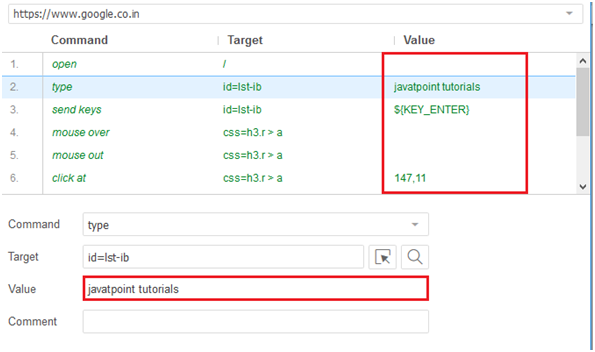
Test Script Editor Box displaysall of the test scripts and user interactions that were recorded by the IDE. Each user interaction is displayed in the same order in which they are performed. The Editor box is divided into three columns:Command, Target and Value.
- Command:
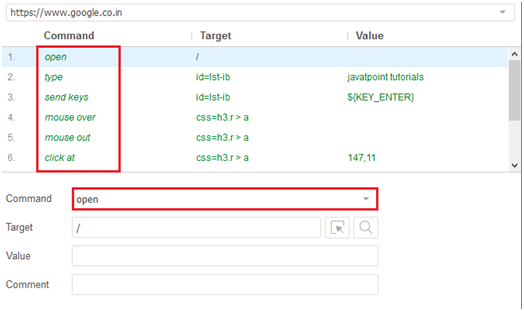
Command can be considered as the actual operation/action that is performed on the browser elements. For instance, if you are opening a new URL, the command will be 'open'; if you are clicking on a link or a button on the web page, then the command will be 'clicked'.
- Target:
Target specifies the web element on which the operation has to be performed along with a locator attribute. For instance, if you are clicking on a button called javaTpoint, then the target link will be 'javaTpoint'.
- Value:
Value is treated as an optional field and can be used when we need to send some actual parameters. For instance, if you are entering the email address or password in a textbox, then the value will contain the actual credentials.
6. Start/Stop Recording Button
Record button records all of the user actions with the browser.
7. Log, Reference Pane
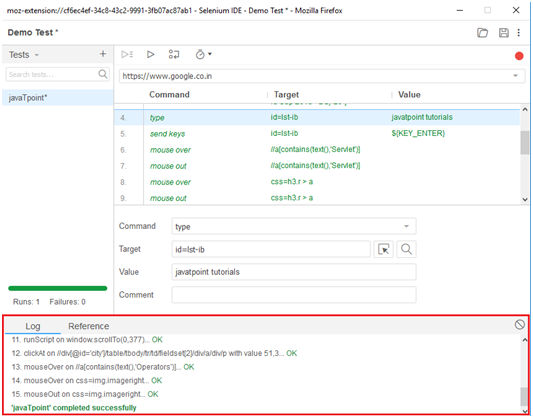
The Log Pane displays the runtime messages during execution. It provides real-time updates of the actions performed by the IDE. It can be categorized into four types: info, error, debug and warn.
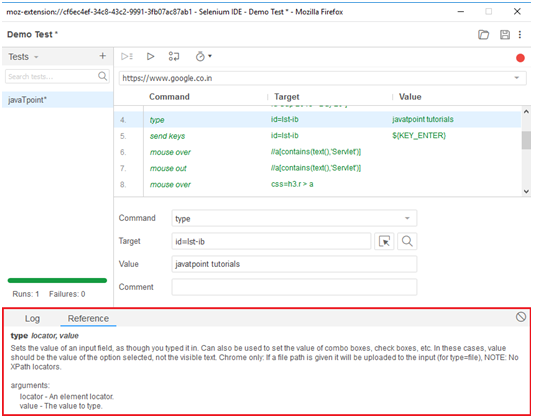
The reference Pane displays the complete detail of the currently selected selenese command in the editor.
