Dark Mode
Image

What is CloudWatch

  • CloudWatch is a service used to monitor your AWS resources and applications that you run on AWS in real time. CloudWatch is used to collect and track metrics that measure your resources and applications.
  • It displays the metrics automatically about every AWS service that you choose.
  • You can create the dashboard to display the metrics about your custom application and also display the metrics of custom collections that you choose.
  • You can also create an alarm to watch metrics. For example, you can monitor CPU usage, disk read and disk writes of Amazon EC2 instance to determine whether the additional EC2 instances are required to handle the load or not. It can also be used to stop the instance to save money.

Following are the terms associated with CloudWatch:

  • Dashboards: CloudWatch is used to create dashboards to show what is happening with your AWS environment.
  • Alarms: It allows you to set alarms to notify you whenever a particular threshold is hit.
  • Logs: CloudWatch logs help you to aggregate, monitor, and store logs.
  • Events: CloudWatch help you to respond to state changes to your AWS resources.

Creating a Dashboard

  • Sign in to the AWS Management Console.
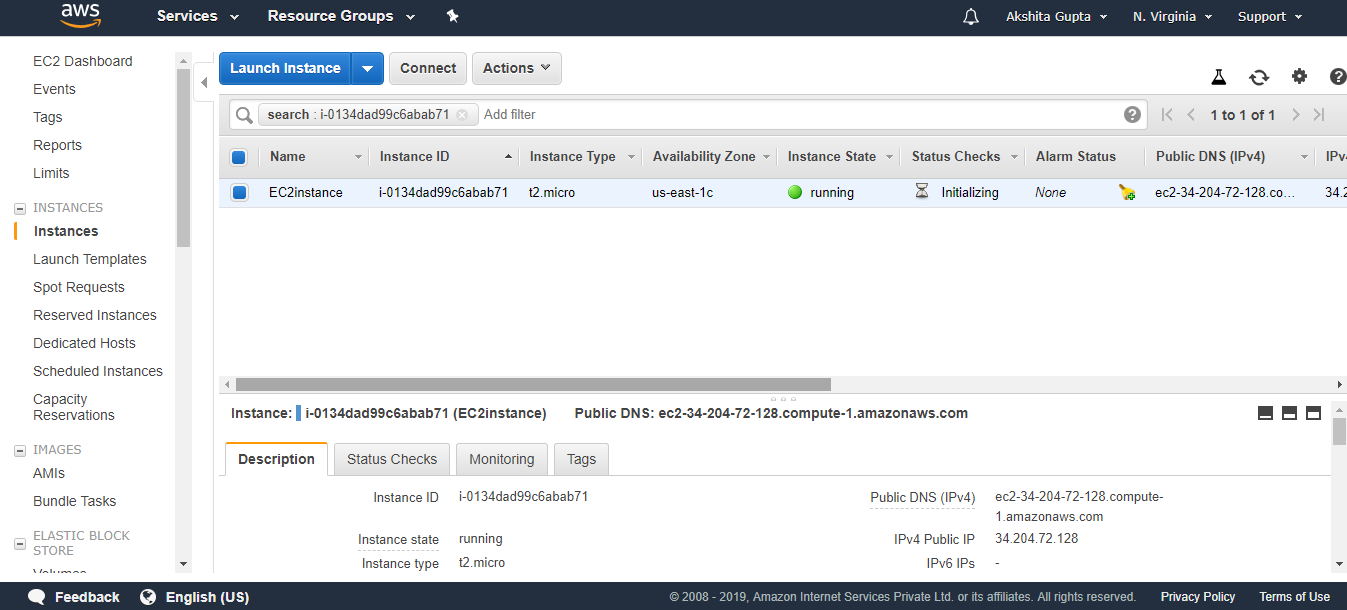
  • I created an EC2 instance, and the name of an EC2 instance is EC2instance.
CloudWatch EC2
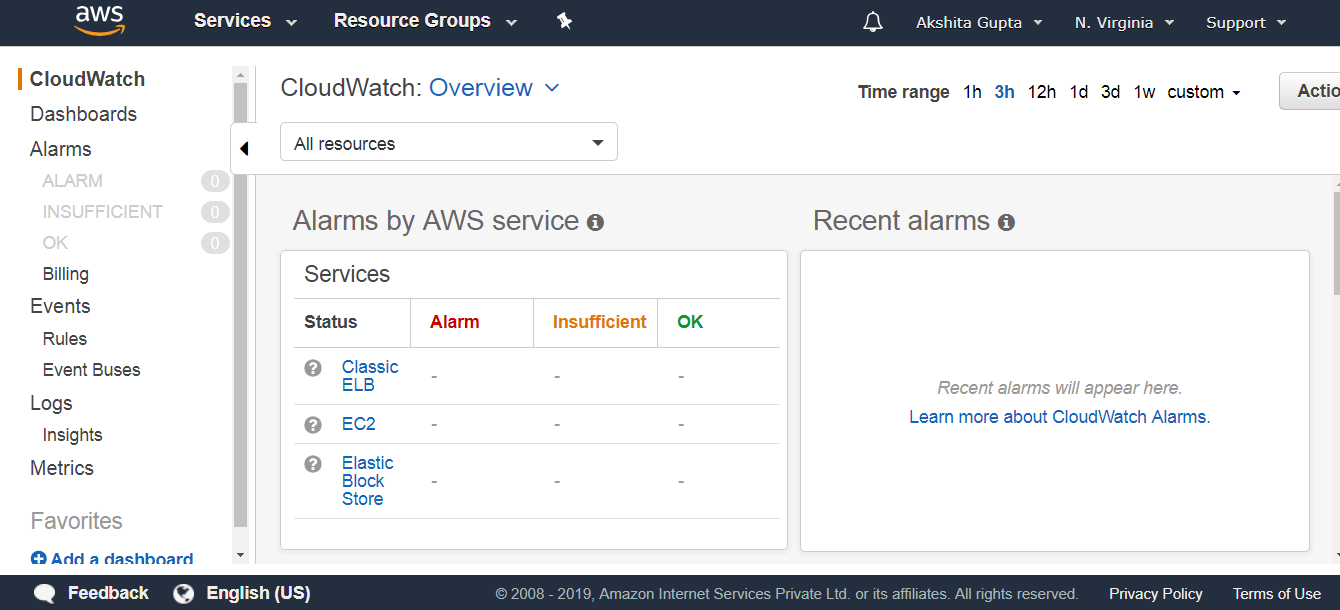
  • Move to the CloudWatch service.
CloudWatch EC2
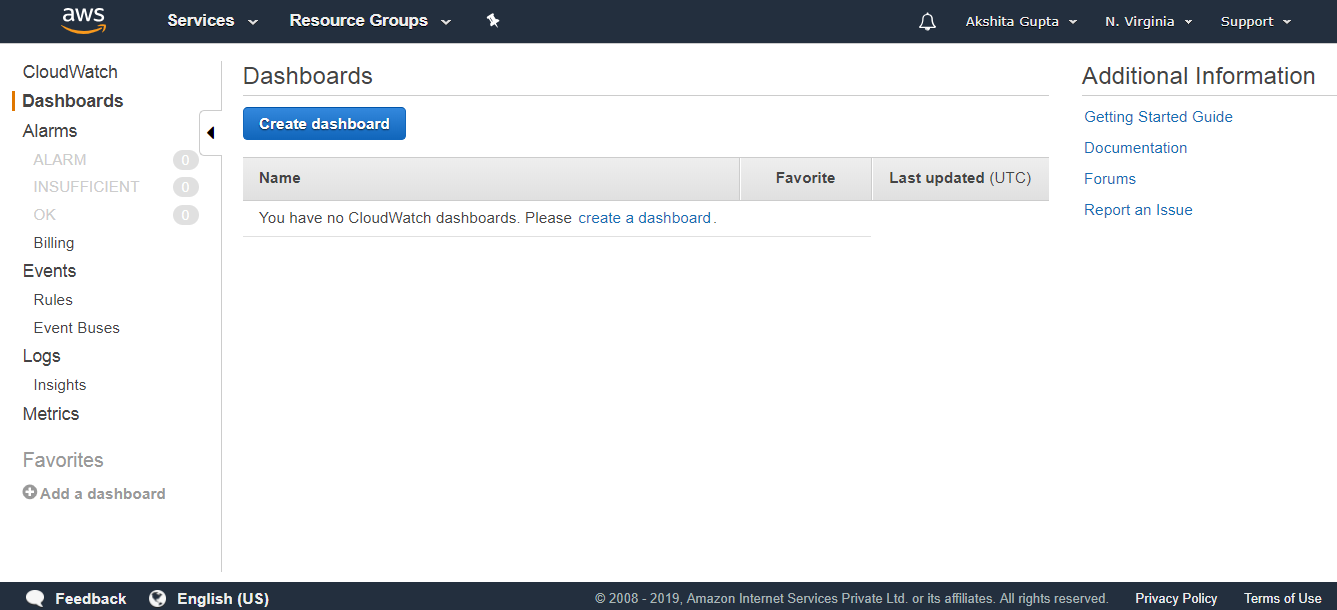
  • Click on the Dashboards appearing on the left side of the console.
CloudWatch EC2
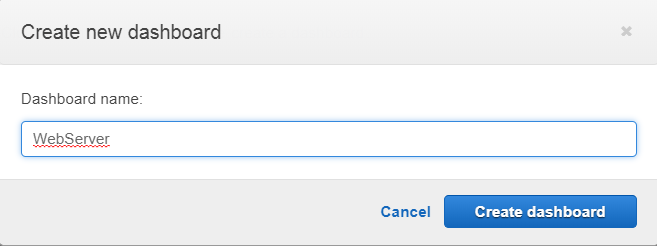
  • Click on the Create dashboard button. Enter the dashboard name. Suppose I write the dashboard name as WebServer.
CloudWatch EC2
  • Click on the Create dashboard.
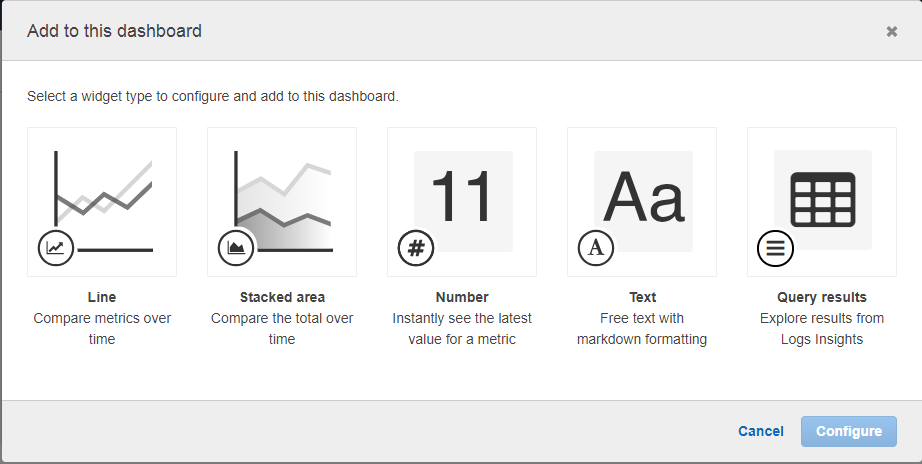
  • Select the widget type and add to the dashboard.
  • I add the Line widget to our dashboard.
CloudWatch EC2
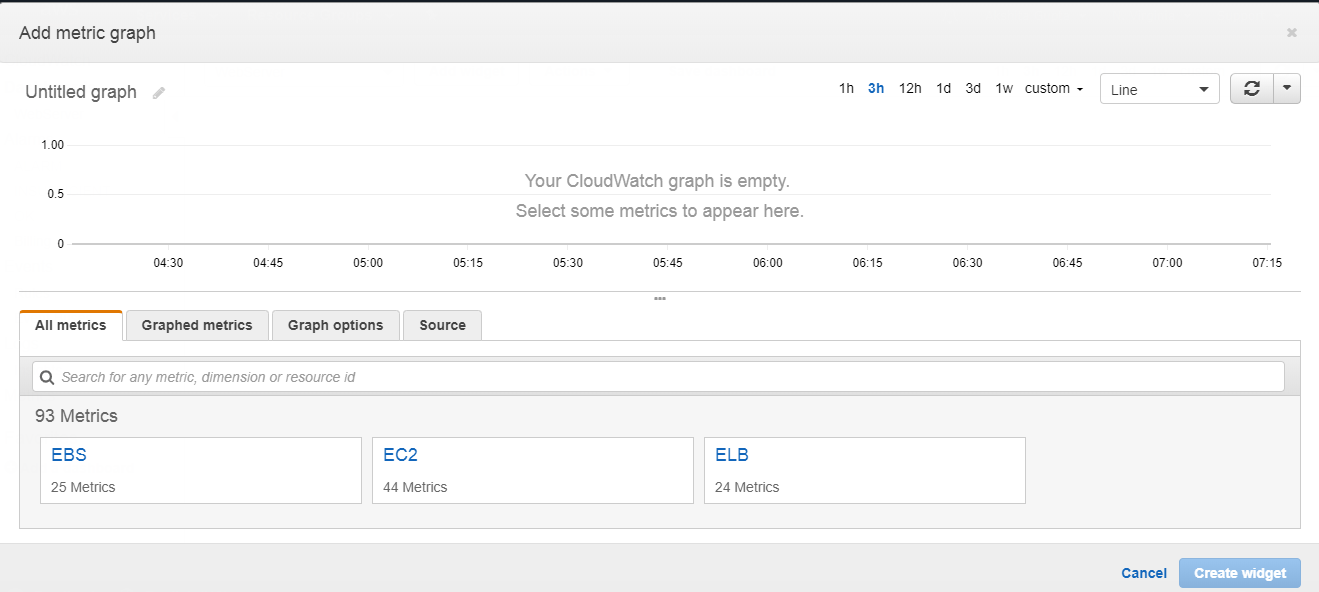
  • After adding a line widget, you have to choose the service. I choose the EC2 service.
CloudWatch EC2
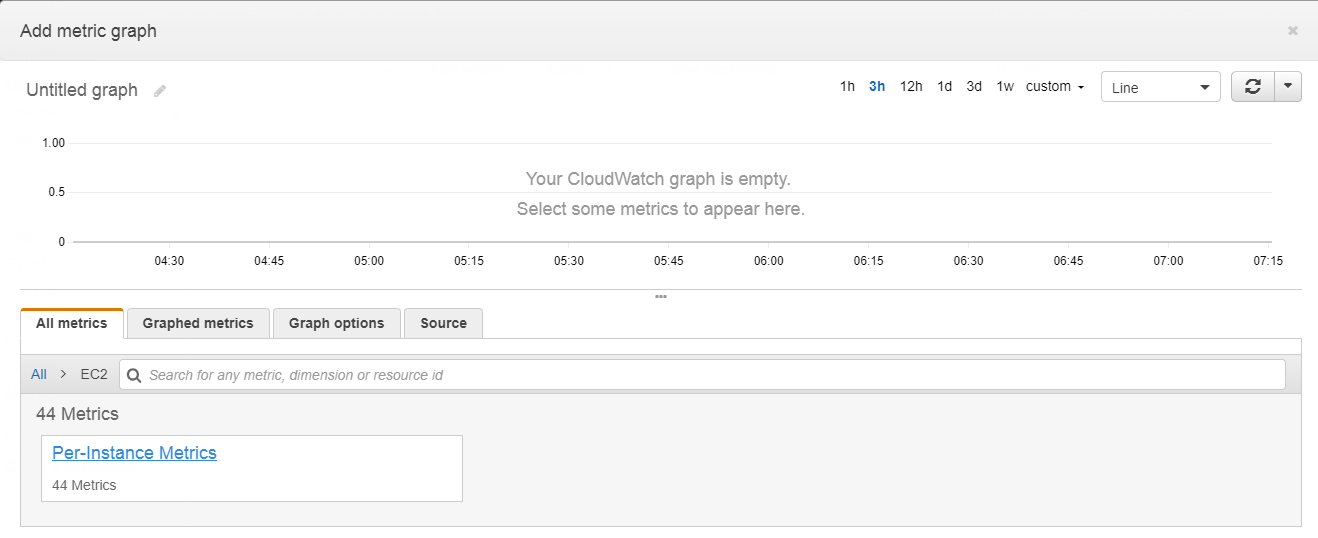
  • Click on the per-instance metrics.
CloudWatch EC2
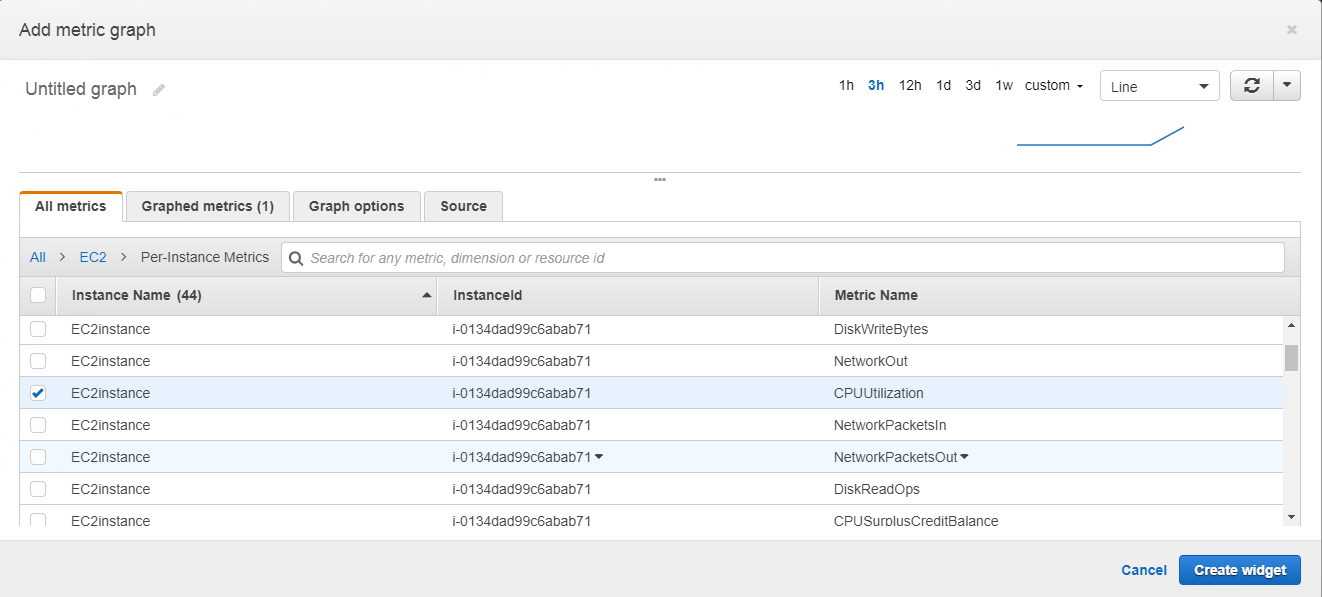
  • Choose the CPUUtilization as a metric name and click on the create widget button.
CloudWatch EC2
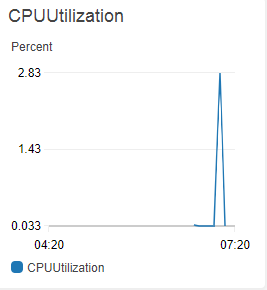
  • The below screen shows the CPU utilization in the form of line widget.
CloudWatch EC2
  • I add another widget known as stacked area.
CloudWatch EC2

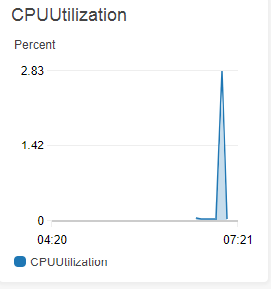
The above screen shows the CPU utilization in the form of a colored graph.

Creating an Alarm
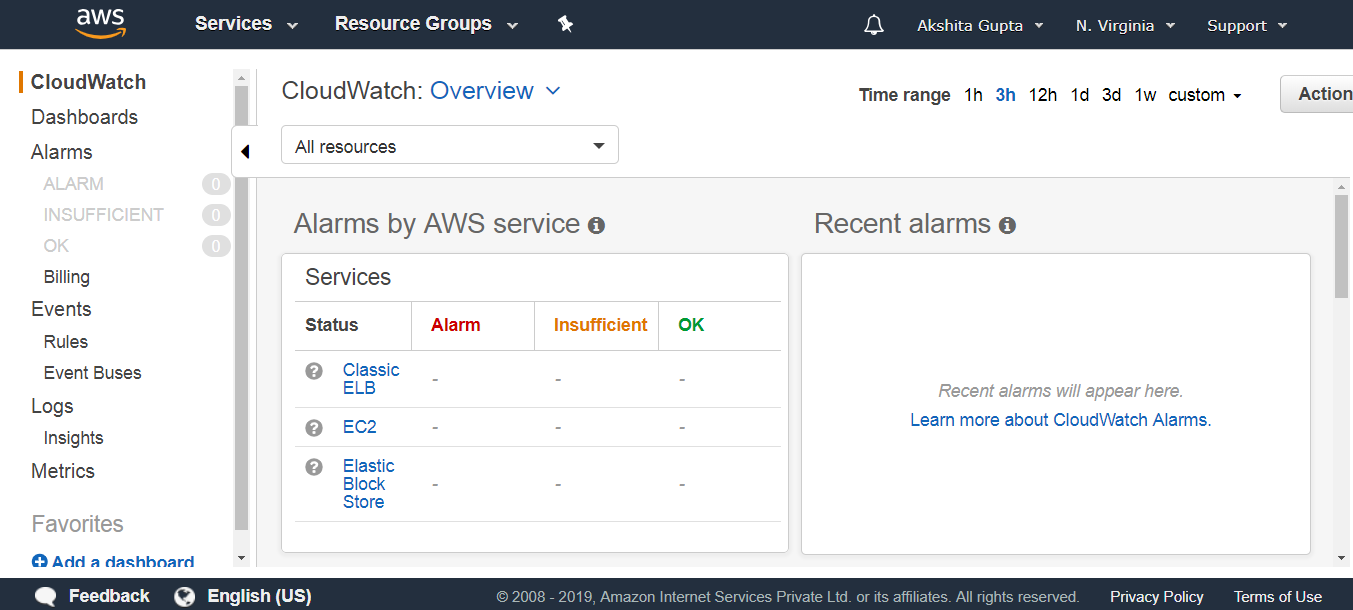
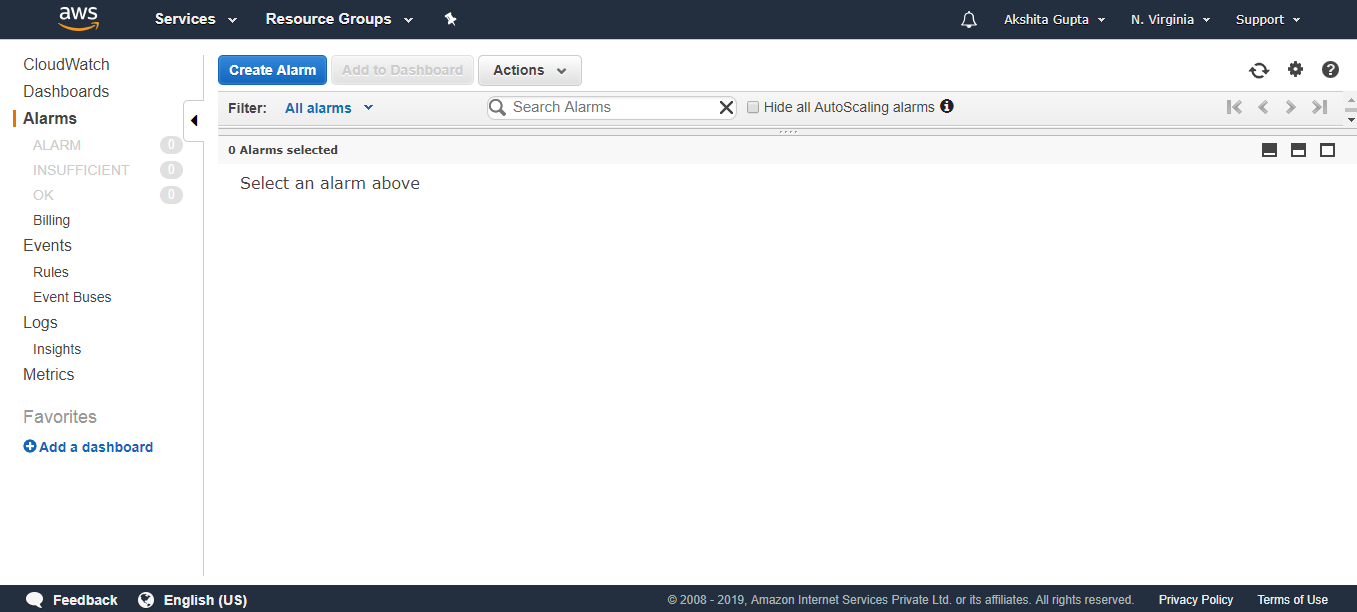
  • Click on the Alarms appearing on the left side of the console.
CloudWatch EC2
  • Click on the Create Alarm.
CloudWatch EC2
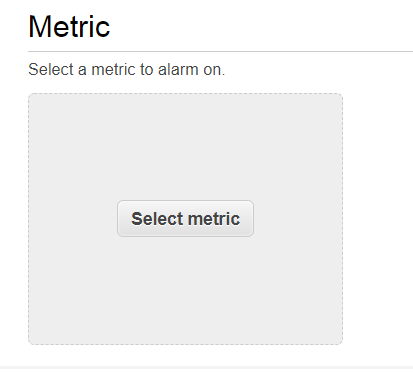
  • Select a metric.


CloudWatch EC2
  • select an EC2.I
CloudWatch EC2
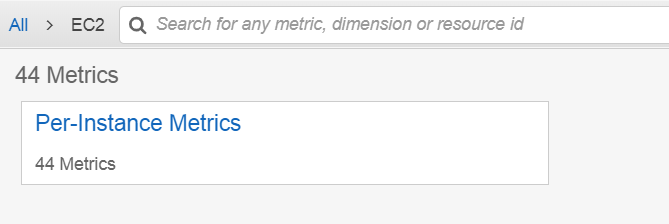
  • Click on the Per-Instance Metrics.
CloudWatch EC2
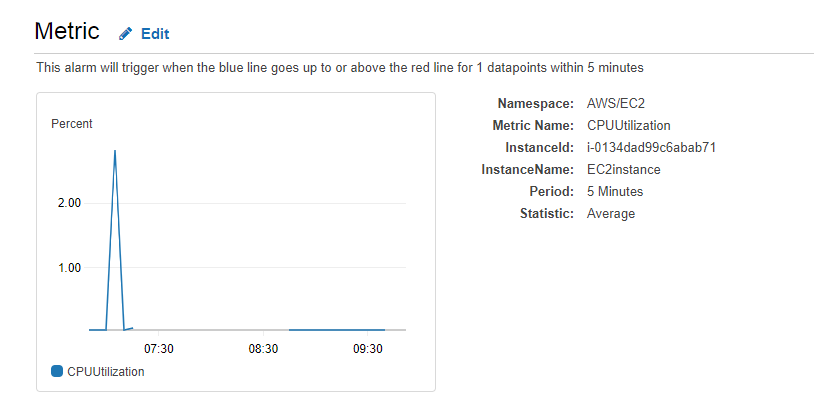
  • I select a CPUUtilization metric.
CloudWatch EC2
CloudWatch EC2
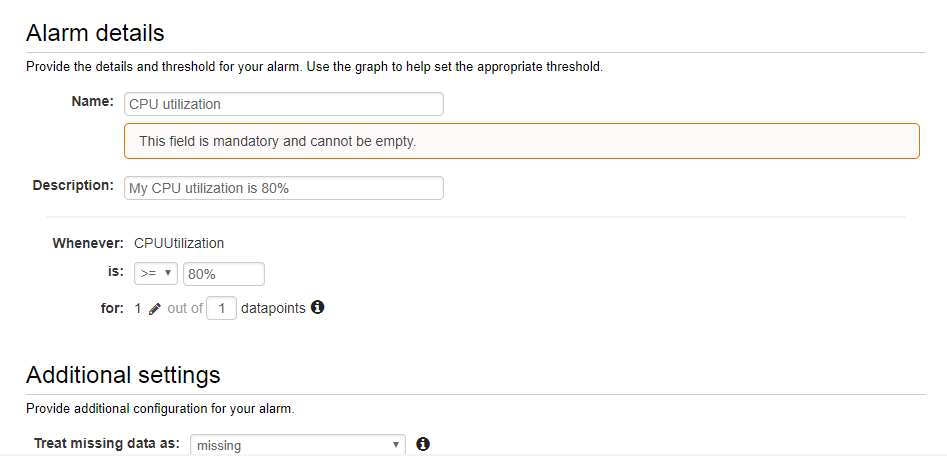
  • Enter the Alarm details.
CloudWatch EC2
CloudWatch EC2

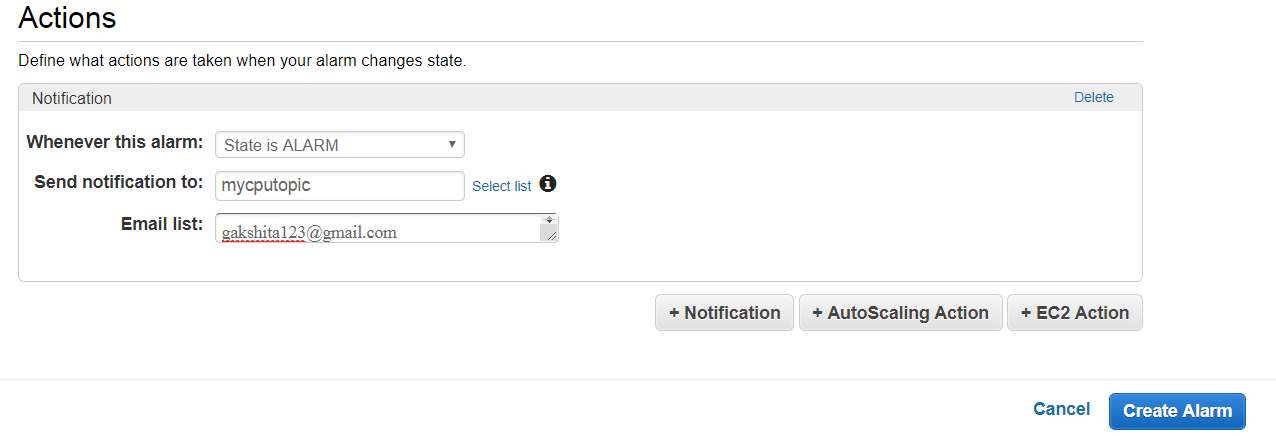
The above details show that when CPU utilization is greater than 80%, then an alarm is triggered and sent to the email address that you mentioned while filling the alarm details.
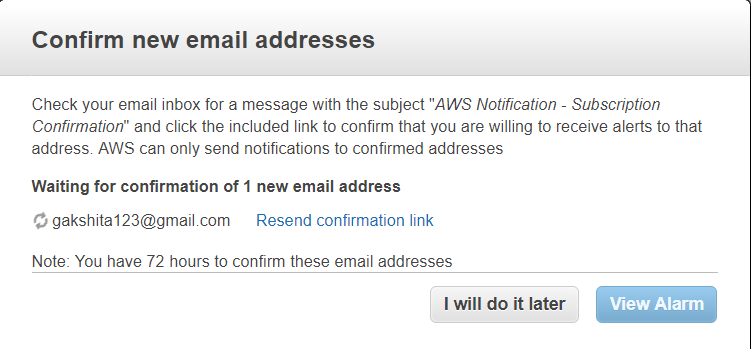
  • Click on the link sent to your email address for confirmation and this confirmation shows that you are ready to receive the alerts.
CloudWatch EC2


Comment / Reply From