Drawing Functions
We can draw the various shapes on an image such as circle, rectangle, ellipse, polylines, convex, etc. It is used when we want to highlight any object in the input image. The OpenCV provides functions for each shape. Here we will learn about the drawing functions.
Drawing Circle
We can draw the circle on the image by using the cv2.circle() function. The syntax is the following:
Parameters:
- img- It represents the given image.
- center- Center of the circle
- radius- Radius of the circle
- color- Circle color
- thickness- It denotes the thickness of the circle outline, if it is positive. And negative thickness means that a filled circle is to be drawn.
- lineType- Defines the type of the circle boundary.
- shift- It represents the number of fractional bits in the coordinate of the center and the radius value.
Consider the following example:
import cv2
img = cv2.imread(r"C:\Users\DEVANSH SHARMA\cat.jpeg",1)
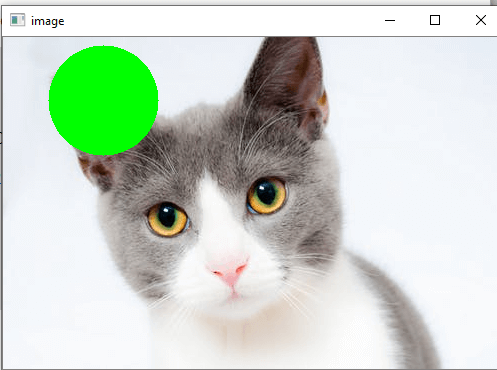
cv2.circle(img,(80,80), 55, (0,255,0), -1)
cv2.imshow('image',img)
cv2.waitKey(0)
cv2.destroyAllWindows()
Output:

Drawing Rectangle
The OpenCV provides a function to draw a simple, thick or filled up-right rectangle. The syntax is following:
Parameters:
- img- It represents an image.
- pt1- It denotes vertex of the rectangle.
- pt2- It denotes the vertex of the rectangle opposite to pt1.
- color- It denotes the rectangle color of brightness (grayscale image).
- thickness- It represents the thickness of the lines that makes up the rectangle. Negative values (CV_FILLED) mean that the function has to draw a filled rectangle.
- linetype- It represents the types of the line.
- shift- It represents the number of fractional bits in the point coordinates.
Consider the following example:
import cv2
img = cv2.imread(r"C:\Users\DEVANSH SHARMA\cat.jpeg",1)
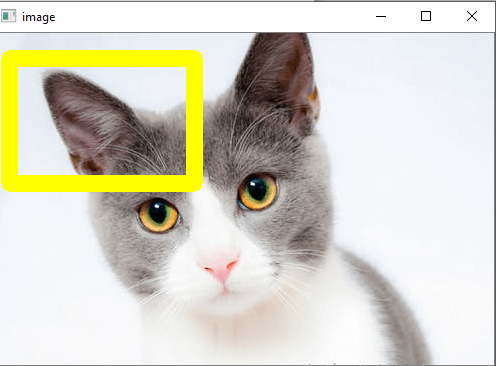
cv2.rectangle(img,(15,25),(200,150),(0,255,255),15)
cv2.imshow('image',img)
cv2.waitKey(0)
cv2.destroyAllWindows()
Output:

Drawing Ellipse
We can draw an ellipse on an image by using the cv2.ellipse() function. It can draw a simple or thick elliptic arc or can fill an ellipse sector.
cv2.ellipse(img, box, color[, thickness[, lineType]])
Parameters:
- img - It represents an image.
- box - It represents alternative ellipse representation via RotatedRect or CvBox2D. It means that the function is used to draws an ellipse in a curved rectangle.
- color - It denotes the ellipse color.
- angle- It denotes the angle of rotation.
- startAngle - It denotes the initial angle of the elliptic arc in degrees.
- endAngle - It denotes the ending angle of the elliptic arc in degrees.
- thickness - It is used to draw thickness of the ellipse arc outline if the value is positive. Otherwise, this specifies that a filled ellipse is to be drawn.
- lineType - It denotes the type of the ellipse boundary.
- shift - It represents the number of fractional bits in the coordinates of the center and values of axes.
Consider the following example:
import cv2
img = cv2.imread(r"C:\Users\DEVANSH SHARMA\cat.jpeg",1)
cv2.ellipse(img, (250, 150), (80, 20), 5, 0, 360, (0,0,255), -1)
cv2.imshow('image',img)
cv2.waitKey(0)
cv2.destroyAllWindows()
Output:

There are two functions to draw the ellipse. The first function is used to draw the whole ellipse, not an arc bypassing startAngle=0 and endAngle = 360. The second function of an ellipse is used to draw an ellipse outline, a filled ellipse, an elliptic arc, or a filled ellipse sector.
Drawing lines
OpenCV provides the line() function to draw the line on the image. It draws a line segment between ptr1 and ptr2 points in the image. The image boundary clips the line.
Parameters:
- img- It represents an image.
- pt1- It denotes the first point of the line segments.
- pt2- It denotes the second point of the line segment.
- color - Represents the Line-color
- thickness- Represents the Line thickness
- lineType- There are various types of line:
- 8 (or omitted) - 8 connected lines.
- 4 - 4-connected line.
- CV__AA- antialiased line
- shift- It represents the number of fractional bits in the point coordinates.
Consider the following example:
import cv2
img = cv2.imread(r"C:\Users\DEVANSH SHARMA\cat.jpeg",1)
cv2.line(img,(10,0),(150,150),(0,0,0),15)
cv2.imshow('image',img)
cv2.waitKey(0)
cv2.destroyAllWindows()
Output:

Write Text on Image
We can write text on the image by using the putText() function. The syntax is given below.
Parameters:
- img: It represents an image
- text: It represents a text which we want to write on the image.
- org: It denotes the Bottom-left corner of the text string in the image.
- font: CvFont structure is initialized using InitFont().
- color: Represents the Text color.
Consider the following example.
import cv2
font = cv2.FONT_HERSHEY_SIMPLEX
# Create a black image.
img = cv2.imread(r"C:\Users\DEVANSH SHARMA\cat.jpeg",1)
cv2.putText(img,'Hack Projects',(10,500), font, 1,(255,255,255),2)
#Display the image
cv2.imshow("image",img)
cv2.waitKey(0)
Output:

Drawing Polylines
We can draw the polylines on the image. OpenCV provides the polylines() function, that is used to draw polygonal curves on the image. The syntax is given below:
Parameters:
- img - It represents an image.
- pts - It denotes the array of polygon curves.
- npts - It denotes an array of polygon vertex counters.
- ncounters - It represents the number of curves.
- is_Closed - It is a flag that indicates whether the drawn polylines are closed or not.
- color - Color of polylines.
- thickness - It represents the Thickness of the polylines edges.
- lineType - Type of the line segment.
- shift- It represents the number of fractional bits in the point coordinates.
Consider the following program to draw polylines in image:
import cv2
img = cv2.imread(r'C:\Users\DEVANSH SHARMA\forest.jpg',cv2.IMREAD_COLOR)
#defining points for polylines
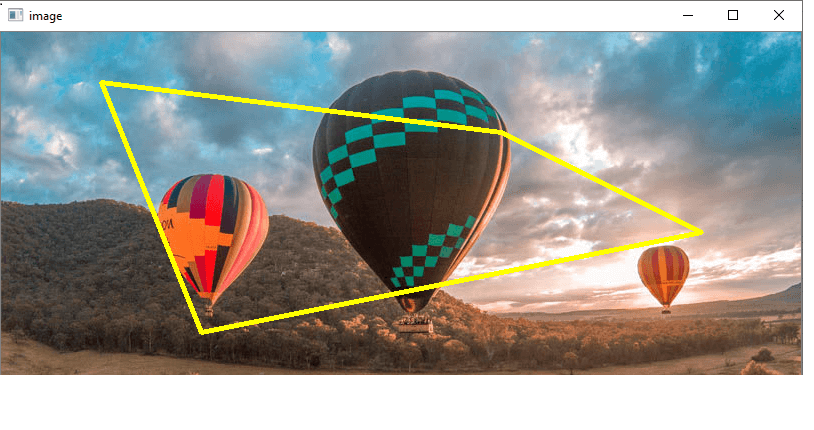
pts = np.array([[100,50],[200,300],[700,200],[500,100]], np.int32)
# pts = pts.reshape((-1,1,2))
cv2.polylines(img, [pts], True, (0,255,255), 3)
cv2.imshow('image',img)
cv2.waitKey(0)
cv2.destroyAllWindows()
Output:


